Blog

  • How to Calculate Your TAM Using Technographic Data

    How to Calculate Your TAM Using Technographic Data

    How to Calculate Your TAM Using Technographic Data

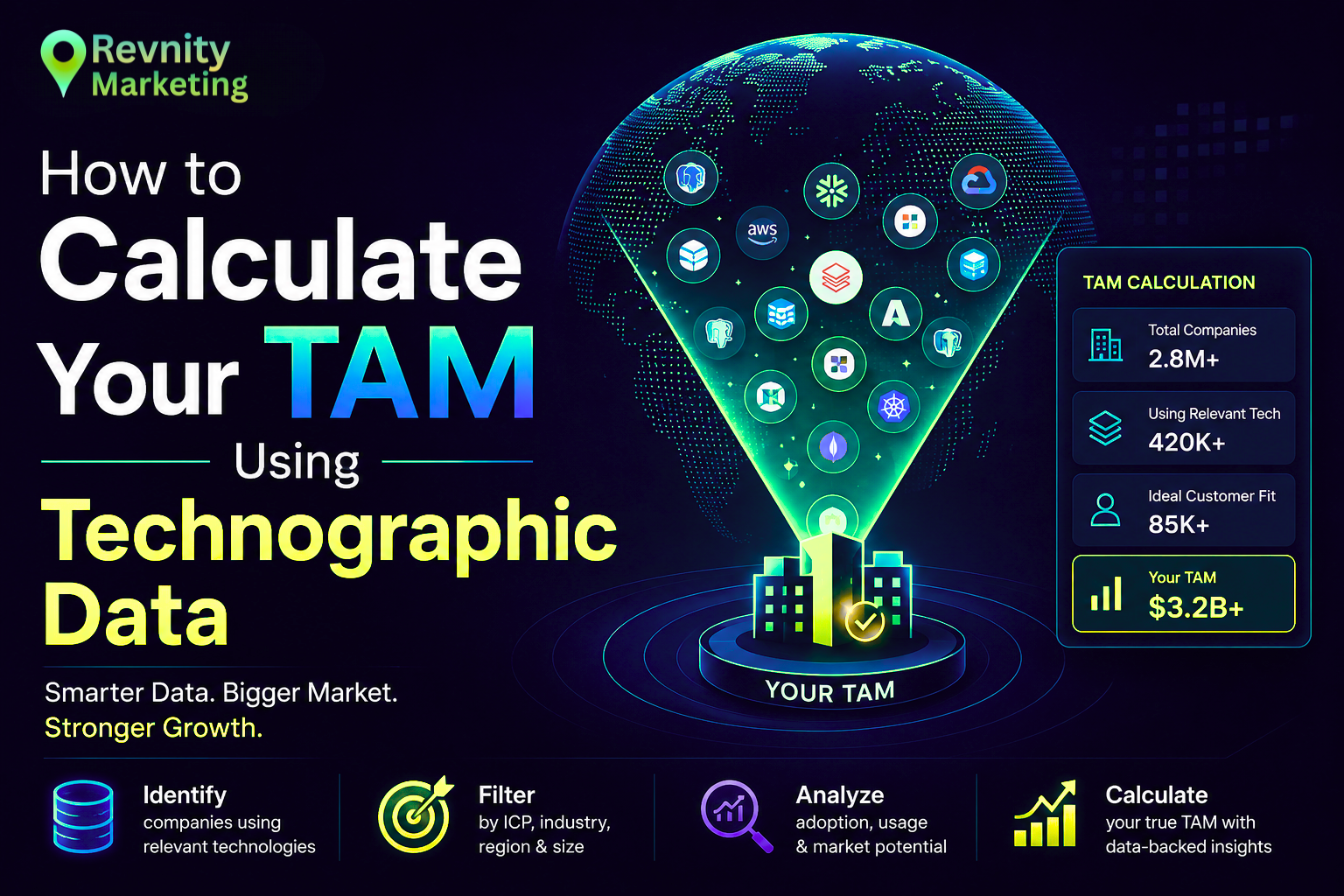
    Most TAM calculations are fiction with a spreadsheet attached. The classic top-down method — take an analyst’s market size, multiply by an assumed share — produces a big number for the pitch deck and nothing a sales team can act on. There’s a better way: build your TAM bottom-up from technographic data, counting the actual companies that run the technologies that make them a fit for what you sell. The number is smaller, but it’s real — and every company in it has a name, a domain, and a decision-maker.

    Top-Down vs. Bottom-Up: Why the Method Matters

    A top-down TAM answers “how big is the market?” A technographic bottom-up TAM answers “exactly which companies could buy from us?” The second question is the one that drives territory planning, quota setting, and campaign budgets. If you sell a Salesforce integration, your TAM isn’t “the CRM market” — it’s the countable set of companies running Salesforce, in your regions, at your target company size. That’s a list, not an estimate.

    The Five-Step Method

    • Step 1: Define your technology qualifiers — the tools a company must run to be a fit (platforms you integrate with, or competitors you displace)
    • Step 2: Pull the install-base counts for those technologies from a verified technographic source
    • Step 3: Apply firmographic guardrails — company size, revenue band, industry, geography — to cut the raw count down to your ICP
    • Step 4: Segment the result into tiers: displacement targets (running a competitor), integration targets (running a complementary tool), and greenfield (running neither)
    • Step 5: Multiply each tier by your average deal size and a realistic win-rate assumption to get TAM, SAM, and a defensible SOM

    TAM

    Every company running a qualifying technology, worldwide

    SAM

    The subset matching your ICP filters and serviceable regions

    SOM

    The tier you can realistically win in 12-24 months

    Worked example: You sell a DocuSign alternative for the DACH region. Raw install base of DocuSign in DACH → filter to 50-1,000 employees → segment by industry fit → you land on a concrete number like 4,200 target accounts. That’s a TAM you can hand to an SDR team on Monday.

    Where Teams Get This Wrong

    Two failure modes show up constantly. First, building the count on modeled technographic data — inferred from job posts and web scrapers — which inflates the install base with companies that stopped using the tool years ago, so the TAM is fiction again, just bottom-up fiction. Second, skipping the firmographic guardrails and presenting the raw install base as addressable, which no board or investor will take seriously. The count is only as credible as the verification behind it.

    A TAM built from verified install-base data isn’t just a market size — it’s your target account list wearing a different name.

    Turning the TAM Into Pipeline

    The real advantage of this method is that the output is immediately actionable: the same dataset that sized your market becomes your campaign list, complete with verified decision-maker contacts. Revnity Marketing maps 35,000+ technologies across 105+ countries and delivers TAM analysis with the underlying account and contact data included — so sizing the market and working the market are one step, not two. See our [Technographic Data] page, or read [how to win your competitors’ customers] for what to do with the displacement tier.

    Want your TAM as a list, not a guess?

  • How to Buy B2B Data Without Breaking GDPR (or CCPA, or CASL)

    How to Buy B2B Data Without Breaking GDPR (or CCPA, or CASL)

    How to Buy B2B Data Without Breaking GDPR (or CCPA, or CASL)

    Every data provider claims to be “fully compliant.” Almost none of them explain what that means — and the difference matters, because when a regulator comes asking, “our vendor said it was fine” is not a defense. The buyer shares responsibility for how data was sourced and how it’s used. If you’re purchasing B2B contact or install-base data for campaigns in Europe, North America, or Canada, here’s what compliance actually looks like region by region, and how to verify it before you sign.

    The Three Regimes You’ll Actually Encounter

    Most B2B data purchases run into one of three frameworks. GDPR (EU/UK) is the strictest on paper but does permit B2B direct marketing under “legitimate interest” — provided the data is relevant to the person’s professional role, they’re told where their data came from, and they can object or be erased easily. CCPA (California) is less about consent and more about disclosure and opt-out rights — people can demand to know what’s held about them and require it not be sold. CASL (Canada) is the strictest of the three for outreach itself: commercial email generally requires consent, with narrow exemptions for existing business relationships and conspicuously published business contact details.

    GDPR

    Legitimate interest can cover B2B outreach, with transparency and objection rights

    CCPA

    Disclosure and opt-out obligations, including on data “sales”

    CASL

    Consent-first regime; the toughest bar for cold email in Canada

    Six Questions to Ask Any Data Provider Before Buying

    • Where was this data sourced? Vague answers (“public sources”) without specifics are a warning sign
    • What’s your lawful basis for processing EU records — and can you document it?
    • How do you handle erasure and objection requests, and do those flow through to data already delivered to clients?
    • How often is the data re-verified? Compliance decays along with accuracy — a lawful record from 2023 may not be lawful today
    • Do you suppress records against known objection/opt-out lists before delivery?
    • Will you put your compliance posture in the contract, not just on the website?

    The simplest compliance test: ask the provider to explain, in writing, the lawful basis for one specific record in your sample file. A serious vendor can answer. A reseller of scraped data usually can’t.

    What Getting It Wrong Actually Costs

    The obvious risk is regulatory — GDPR fines can reach 4% of global turnover, and CASL penalties run to millions of dollars per violation. But the more common cost is quieter: spam complaints that burn sending domains, prospects in EMEA who escalate instead of unsubscribing, and enterprise deals that die in vendor security review because your data sourcing couldn’t survive a due-diligence questionnaire. Compliance isn’t just legal protection — it’s deliverability and deal protection.

    Compliant data isn’t a certificate a vendor shows you. It’s a set of practices you can verify — sourcing, transparency, suppression, and re-verification.

    How Revnity Marketing Approaches This

    Revnity Marketiing maintains compliance with GDPR, CCPA, and CASL across coverage spanning 105+ countries — with documented sourcing, suppression handling, and re-verification built into delivery rather than bolted on afterward. Combined with verified accuracy (see [why most technographic data is wrong]), that means the data you buy is both usable and defensible. Explore our [Technographic Data] coverage, or read [how to improve email deliverability with verified data] for the sending side of the equation.

    Need data that survives a compliance review?

  • The Buyer Research You Can’t See: AI Chatbots Are Eating Intent Data

    The Buyer Research You Can’t See: AI Chatbots Are Eating Intent Data

    The Buyer Research You Can’t See

    For a decade, intent data worked on a simple premise: buyers research on the open web, and that research leaves trackable footprints — content consumption, review-site visits, comparison pages. In 2026, a growing share of that research has moved somewhere trackers can’t follow: inside ChatGPT, Perplexity, and Google’s AI Overviews. A buyer can now shortlist vendors, compare pricing, and read summarized reviews without generating a single signal a traditional intent platform can see.

    What This Breaks — and What It Doesn’t

    This shift doesn’t make intent data useless, but it thins the topic-surge layer that many platforms are built on. What it can’t erase are signals rooted in facts rather than behavior: what technology a company actually runs, who its decision-makers actually are, and what real-world events — an acquisition, a regulatory deadline, a vendor price change — are forcing a decision. Behavioral signals can go dark. Factual signals can’t.

    Invisible

    AI-chat research generates no trackable intent footprint

    Growing

    Share of B2B buyers using AI assistants for vendor evaluation

    Verifiable

    Install-base facts remain observable regardless of where research happens

    How Teams Are Adapting

    • Optimizing to appear inside AI-generated answers (AEO) — so you’re in the shortlist the chatbot writes
    • Layering multiple signal sources instead of relying on one intent feed
    • Anchoring outreach on verified technographic facts — the signal that doesn’t depend on tracking

    You can’t track a conversation with a chatbot. You can still know exactly which companies run your competitor’s platform.

    This is why technographic data is becoming more valuable as behavioral intent gets murkier: it’s a ground-truth signal. Revnity provides verified install-base and decision-maker data across North America, EMEA, APAC, and LATAM — see our [Technographic Data] page, and our post on [tech stack changes as a buying signal] for how to build plays on it.

  • Your Contact Database Is Rotting 2% Every Month — Here’s the Math

    Your Contact Database Is Rotting 2% Every Month

    B2B contact data decays at roughly 2.1% per month. In the tech sector, annual churn on contact records reaches around 40% — people change jobs, companies switch tools, titles get reshuffled. That means the “fresh” list you bought in January is measurably degraded by June, and nearly half-wrong by the following year. This isn’t a vendor problem you can name and shame — it’s physics. The real problem is what the industry does about it: mostly nothing, and mostly silently.

    The Silent Part: Nobody Tells You When a Record Was Last Checked

    Here’s the detail that should bother you more than the decay rate itself: major data providers generally don’t publish last-verified timestamps on their records. Refresh cycles are opaque — analysis suggests some records go six months or more without re-verification, especially for smaller accounts. So freshness degrades invisibly. You find out a record is stale the moment it bounces, or when a confused stranger answers the phone.

    2.1%

    Monthly B2B contact data decay

    ~40%

    Annual contact churn in the tech sector

    50-65%

    Typical contact match-rate ceiling for single-source data APIs

    What Decay Actually Costs You

    • Bounces that damage sender reputation — compounding across every future campaign
    • SDR hours spent on dead records — the most expensive way to discover staleness
    • Displacement pitches referencing tools no longer in use — credibility damage you can’t A/B test away

    Quick self-audit: ask your current data provider one question — “When was this record last verified?” If they can’t answer per-record, you’re buying decay on a delay.

    Revnity’s answer to decay is verification at delivery plus contractual accountability: 100% technology accuracy, 98% deliverability, and free replacement of any inaccurate record. Decay still happens — but you’re never the one absorbing its cost. Read [why most technographic data is wrong] for how verification actually works, or see our Technographic Data page.

    Want data verified at delivery, not at purchase?

  • Tech Stack Changes Are the Most Underused Buying Signal in B2B

    Tech Stack Changes Are the Most Underused Buying Signal in B2B

    Tech Stack Changes Are the Most Underused Buying Signal in B2B

    Signal-based selling has become the defining outbound methodology of 2026. Instead of working a static ICP list top to bottom, teams now trigger outreach from observable events: a funding round, a new VP of Sales, a hiring spike. Research shows programs that stack multiple account signals generate 2.6x more pipeline per marketing dollar than broad demand generation, with 41% higher win rates. But one signal consistently gets less attention than the rest — and it’s arguably the strongest one.

    The Signal Everyone Lists but Nobody Operationalizes

    Every 2026 signal-selling guide includes “tech stack changes” on its list — a company adopting HubSpot, dropping Salesforce, or sitting on a platform whose vendor just got acquired. It signals pain, budget, and timing simultaneously. Yet most teams never operationalize it, for one simple reason: funding announcements and job posts are public and easy to track. Verified technology usage isn’t. You can’t set a Google Alert for “companies still running a legacy CX platform.

    2.6x

    More pipeline per dollar from stacked-signal programs

    41%

    Higher win rates vs broad-reach demand gen

    2-5x

    Typical reply rate lift when outreach references a real, current signal

    Three Technographic Signals Worth Building Plays Around

    • Vendor acquisition or merger — the install base enters a 6-18 month re-evaluation window (see our post on the [Salesforce-Fin acquisition])
    • Price-model changes — a vendor restructures licensing and its customers start shopping
    • Regulatory shifts — compliance deadlines force companies off non-compliant tools

    A funding round tells you a company has money. A tech stack signal tells you what they’re likely to spend it replacing.

    The Catch: This Signal Is Only as Good as Its Verification

    A displacement email referencing a tool the prospect stopped using last year doesn’t just get ignored — it actively burns credibility. That’s why signal-based plays built on modeled technographic data underperform: the signal itself is often wrong. Revnity provides verified install-base data — confirmed usage, current decision-makers — so the signal you’re acting on is real. Explore our [Technographic Data] coverage.

    Want to build a displacement play on a verified signal?

  • Your AI SDR Isn’t Broken — Your Data Is

    Your AI SDR Isn’t Broken — Your Data Is

    Your AI SDR Isn’t Broken — Your Data Is

    AI SDRs were supposed to be the biggest productivity unlock in outbound sales. The market is growing fast — projected to more than triple by 2030 — and adoption is real. But there’s an uncomfortable number hiding behind the hype: industry research in 2026 shows annual churn on AI SDR tools running at 50-70%, roughly double the turnover rate of human SDRs. Teams are buying these tools, running them for a few months, and quietly switching them off.

    Why AI SDRs Fail: It’s Almost Never the AI

    When an AI SDR deployment stalls, the post-mortem usually blames the tool — the emails felt robotic, replies didn’t convert, deliverability tanked. But dig one layer deeper and a pattern emerges: the AI was pointed at bad data. Wrong titles, stale contacts, companies that stopped using the technology being referenced eight months ago. An AI SDR sending 10x the volume of a human doesn’t fix bad data — it multiplies the damage 10x faster.

    50-70%

    Annual churn on AI SDR tools (2026 industry data)

    ~15% vs ~25%

    Meeting-to-opportunity conversion, stalled AI deployments vs human SDRs

    1.9x

    More meetings per dollar from hybrid human+AI pods vs AI-only

    Deliverability Problems Are Usually Data Problems in Disguise

    Here’s the part most teams miss: what shows up as a “deliverability problem” is very often a data accuracy problem wearing a costume. High bounce rates come from unverified email data. Burned domains come from high bounce rates. No sequencing tool’s guardrails can compensate when the underlying records are wrong. The fix isn’t a better warm-up tool — it’s verified data at the source.

    Before you fire your AI SDR, audit your data. If your contact records don’t have a verified date, you don’t have a tooling problem — you have an input problem.

    What “AI-Ready” Data Actually Looks Like

    • Verified technology usage — the AI references a tool the prospect actually still runs
    • Current decision-maker roles — checked at delivery, not scraped a year ago
    • Deliverability-tested emails — so volume doesn’t destroy your domain reputation
    • Accuracy guarantees in writing — replacements on bad records, not apologies

    This is exactly why Revnity contractually guarantees technology accuracy and 98% deliverability with free replacements on inaccurate records. Verified data is what makes AI outbound compound instead of collapse. See our [Technographic Data] page, or read [why most technographic data is wrong] for the modeled-vs-verified breakdown.

    Running AI outbound on unverified data?

  • Salesforce Is Acquiring Intercom’s Fin,  What It Means If You’re on the Platform

    Salesforce Is Acquiring Intercom’s Fin, What It Means If You’re on the Platform

    Salesforce Is Acquiring Fin (Intercom) — What Happens to Existing Customers?

    On June 15, 2026, Salesforce signed a definitive agreement to acquire Fin, the AI customer service platform formerly known as Intercom, in a deal worth $3.6 billion. The deal is expected to close between November 2026 and January 2027. For the roughly 30,000 customer service teams currently running on Fin, this isn’t just a headline — it’s the start of a planning conversation that usually gets delayed until it’s urgent.

    Why Acquisitions Like This Trigger a Re-Evaluation

    Whenever a platform gets folded into a larger ecosystem, a few things tend to happen — not immediately, but within the first 12-18 months: pricing structures shift toward the parent company’s model, product roadmaps get reprioritized around the acquirer’s strategy, and standalone tools risk losing the focus they had as an independent product. None of this means Fin is going away tomorrow. It does mean the terms most customers signed up for were written for a different company than the one that will eventually own the platform.

    $3.6B — Acquisition value

    ~30,000 — Customer service teams currently on Fin

    6-18 months — Typical enterprise re-evaluation window after a major acquisition

    What Fin Customers Should Be Watching For

    • Integration timeline into Salesforce’s existing Service Cloud stack
    • Pricing changes once the deal closes (expected Nov 2026-Jan 2027)
    • Whether Fin remains a standalone product or gets absorbed into a broader Salesforce bundle
    • Contract renewal terms coming up during or after the transition window

    This pattern isn’t new. Similar acquisitions in the CX and CRM space have historically led to bundled pricing, forced migrations, or feature deprioritization for the acquired product within a year or two of closing. Teams that start evaluating alternatives early — before a forced renewal deadline tend to have more leverage than those who wait.

    Major vendor consolidation rarely changes anything on day one. It’s the 12-18 months after close where customers actually feel the shift.

    How Revnity Marketing Can Help

    We track verified install-base data for CX and customer service platforms, including companies currently running Fin/Intercom. If you’re evaluating alternatives — or building a GTM motion targeting this displacement window — we can provide a verified list of companies still on the platform, not a modeled guess. See our TECHNOGRAPHIC INTELLIGENCE page for coverage details.

    Building outreach around this acquisition?

    Request a sample file of verified Fin/Intercom install-base data

  • Why Data Hygiene Is the Most Underrated GTM Lever

    Why Data Hygiene Is the Most Underrated GTM Lever

    Everyone wants more leads. Almost nobody wants to spend an afternoon cleaning the ones they already have. That’s backwards — a dirty database doesn’t just sit there being unhelpful, it actively taxes every team that touches it, from SDRs to the person building the board deck.

    Analyst reviewing data quality reports

    The Compounding Cost of Dirty Data

    A single bad record is a rounding error. Ten thousand of them, compounding for two years without a cleanup pass, is a forecast nobody trusts and a routing engine that quietly sends leads to the wrong rep. The cost isn’t the bad data itself — it’s every downstream decision made on top of it.

    • Marketing reports inflated audience sizes because duplicate and dead contacts are still counted.
    • Lead scoring misfires because firmographic fields no longer match reality.
    • Sales forecasting drifts because deal-to-account matching breaks on inconsistent company names.

    A Lighter-Weight Hygiene Loop

    Data hygiene doesn’t need to be a quarterly fire drill. Treat it as a standing process instead: verify new records at the point of capture, run a scheduled refresh on the active database, and re-verify high-value accounts before any major campaign send.

    The teams with the cleanest CRMs aren’t the ones who ran the biggest cleanup project. They’re the ones who never let it get dirty enough to need one.

    Where to Start Monday Morning

    Pick the one field your routing or scoring model depends on most — usually title or company size — and audit just that field across your highest-value segment. Fixing the field that actually drives a decision beats a broad, shallow cleanup every time.

  • The ABM Data Stack: A Quick-Start Framework

    The ABM Data Stack: A Quick-Start Framework

    Most ABM programs don’t fail because the strategy is wrong. They fail because the data underneath it is thinner than the strategy assumes — a spreadsheet of target accounts with no way to tell which ones are actually ready. Here’s a lean, three-layer stack that fixes that without requiring a data team.

    A target account list without technographic and behavioral context is just a firmographic guess dressed up as a strategy.

    The Three Layers of an ABM-Ready Data Stack

    Each layer answers a different question, and none of them is sufficient on its own:

    LayerWhat It AnswersPrimary SourceUpdate Cadence
    FirmographicIs this the right size and industry?Company recordsQuarterly
    TechnographicDo they run the tools we integrate with or displace?Stack scansMonthly
    Behavioral / IntentAre they in-market right now?Intent signalsWeekly

    Why Teams Under-Invest in the Middle Layer

    Dashboard showing account segmentation

    Firmographic data is easy to buy and behavioral data gets all the attention, so the technographic layer — the one that tells you whether an account is structurally ready for your category — is the one most teams skip. It’s also the layer with the clearest return:

    3.2x

    Higher conversion on technographic-targeted outreach

    45K+

    Technology products tracked across active accounts

    105+

    Countries with verified technographic coverage

    Rolling It Out in Four Steps

    1. Define the ICP with firmographic guardrails first — size, industry, geography.
    2. Layer in technographic filters: complementary stack, competitor install base, or capability gaps.
    3. Add a behavioral signal to time outreach — search intent, hiring signals, or funding events.
    4. Push the combined segment into your CRM and sequencing tool as one list, not three.

    The output is a shortlist that’s both a good fit and actively in-market — the combination every SDR team wishes they started with.

    Want the data behind your next ABM push?

    Get a free sample of technographic and firmographic data filtered to your exact ICP.

  • 5 Signs Your CRM Data Needs a Refresh

    5 Signs Your CRM Data Needs a Refresh

    Stale CRM records don’t announce themselves. There’s no alert that fires when a title changes or a contact leaves a company — the record just quietly stops being useful. By the time reps notice, a meaningful slice of the pipeline has already been built on sand. Here are five signs it’s time for a refresh, and what a refresh actually involves.

    1. Bounce Rates Are Creeping Up

    A rising hard-bounce rate is the clearest signal your list is aging. Mailbox providers track it closely, and a spike doesn’t just cost you that one send — it throttles deliverability for everything that follows. If bounce rates have drifted up over the last two quarters without a change in list size, decay is the likely cause.

    Team reviewing CRM data on a laptop

    2. Reps Are Manually Fixing Fields Every Week

    When account executives spend Monday mornings correcting job titles and company names by hand, that’s unpaid data entry labor hiding inside a sales role. It’s also a sign the underlying enrichment process isn’t running often enough to keep pace with how fast contacts actually change jobs.

    3. Firmographic Filters Return Inconsistent Results

    Segment your database by employee count or industry and compare it against what you know to be true about a handful of accounts. If the filtered list doesn’t match reality, the firmographic fields feeding that filter are out of date — and every list built on top of them inherits the error.

    • Run a monthly spot-check: pull 20 accounts you know well and verify title, size, and industry.
    • Track hard-bounce rate as a leading indicator, not just a deliverability metric.
    • Ask reps directly — they feel decay before any dashboard shows it.

    4. Job Titles No Longer Match Reality

    Title data decays faster than almost any other field. Someone promoted from manager to director six months ago is still being routed and scored as a manager, which quietly misfires your lead scoring and account routing rules.

    5. Your Best Reps Quietly Stopped Trusting the CRM

    This is the sign that matters most. When your top performers start keeping their own spreadsheets on the side instead of trusting CRM fields, they’ve already told you the data isn’t reliable — they just haven’t said it in a meeting yet.

    Stale data doesn’t just sit there quietly. It actively misroutes leads, corrupts forecasts, and erodes trust in every dashboard built on top of it.

    Fixing It Without a Big Project

    A refresh doesn’t need to be a quarter-long initiative. Start with the fields that drive routing and scoring — email, title, and firmographics — enrich those first, and put a recurring cadence in place so the database never drifts this far again.