Category: ABM

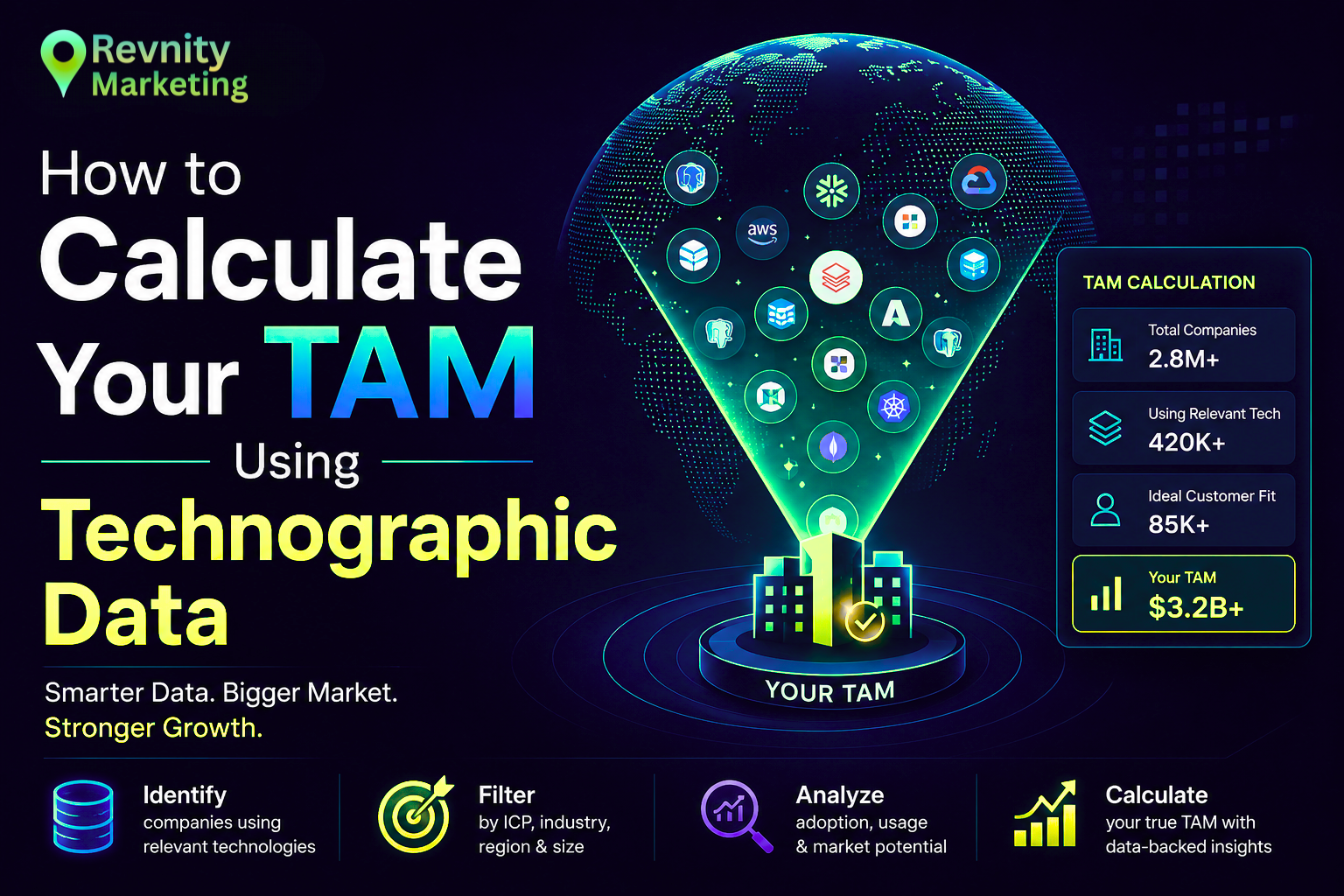
  • How to Calculate Your TAM Using Technographic Data

    How to Calculate Your TAM Using Technographic Data

    How to Calculate Your TAM Using Technographic Data

    Most TAM calculations are fiction with a spreadsheet attached. The classic top-down method — take an analyst’s market size, multiply by an assumed share — produces a big number for the pitch deck and nothing a sales team can act on. There’s a better way: build your TAM bottom-up from technographic data, counting the actual companies that run the technologies that make them a fit for what you sell. The number is smaller, but it’s real — and every company in it has a name, a domain, and a decision-maker.

    Top-Down vs. Bottom-Up: Why the Method Matters

    A top-down TAM answers “how big is the market?” A technographic bottom-up TAM answers “exactly which companies could buy from us?” The second question is the one that drives territory planning, quota setting, and campaign budgets. If you sell a Salesforce integration, your TAM isn’t “the CRM market” — it’s the countable set of companies running Salesforce, in your regions, at your target company size. That’s a list, not an estimate.

    The Five-Step Method

    • Step 1: Define your technology qualifiers — the tools a company must run to be a fit (platforms you integrate with, or competitors you displace)
    • Step 2: Pull the install-base counts for those technologies from a verified technographic source
    • Step 3: Apply firmographic guardrails — company size, revenue band, industry, geography — to cut the raw count down to your ICP
    • Step 4: Segment the result into tiers: displacement targets (running a competitor), integration targets (running a complementary tool), and greenfield (running neither)
    • Step 5: Multiply each tier by your average deal size and a realistic win-rate assumption to get TAM, SAM, and a defensible SOM

    TAM

    Every company running a qualifying technology, worldwide

    SAM

    The subset matching your ICP filters and serviceable regions

    SOM

    The tier you can realistically win in 12-24 months

    Worked example: You sell a DocuSign alternative for the DACH region. Raw install base of DocuSign in DACH → filter to 50-1,000 employees → segment by industry fit → you land on a concrete number like 4,200 target accounts. That’s a TAM you can hand to an SDR team on Monday.

    Where Teams Get This Wrong

    Two failure modes show up constantly. First, building the count on modeled technographic data — inferred from job posts and web scrapers — which inflates the install base with companies that stopped using the tool years ago, so the TAM is fiction again, just bottom-up fiction. Second, skipping the firmographic guardrails and presenting the raw install base as addressable, which no board or investor will take seriously. The count is only as credible as the verification behind it.

    A TAM built from verified install-base data isn’t just a market size — it’s your target account list wearing a different name.

    Turning the TAM Into Pipeline

    The real advantage of this method is that the output is immediately actionable: the same dataset that sized your market becomes your campaign list, complete with verified decision-maker contacts. Revnity Marketing maps 35,000+ technologies across 105+ countries and delivers TAM analysis with the underlying account and contact data included — so sizing the market and working the market are one step, not two. See our [Technographic Data] page, or read [how to win your competitors’ customers] for what to do with the displacement tier.

    Want your TAM as a list, not a guess?

  • The ABM Data Stack: A Quick-Start Framework

    The ABM Data Stack: A Quick-Start Framework

    Most ABM programs don’t fail because the strategy is wrong. They fail because the data underneath it is thinner than the strategy assumes — a spreadsheet of target accounts with no way to tell which ones are actually ready. Here’s a lean, three-layer stack that fixes that without requiring a data team.

    A target account list without technographic and behavioral context is just a firmographic guess dressed up as a strategy.

    The Three Layers of an ABM-Ready Data Stack

    Each layer answers a different question, and none of them is sufficient on its own:

    LayerWhat It AnswersPrimary SourceUpdate Cadence
    FirmographicIs this the right size and industry?Company recordsQuarterly
    TechnographicDo they run the tools we integrate with or displace?Stack scansMonthly
    Behavioral / IntentAre they in-market right now?Intent signalsWeekly

    Why Teams Under-Invest in the Middle Layer

    Dashboard showing account segmentation

    Firmographic data is easy to buy and behavioral data gets all the attention, so the technographic layer — the one that tells you whether an account is structurally ready for your category — is the one most teams skip. It’s also the layer with the clearest return:

    3.2x

    Higher conversion on technographic-targeted outreach

    45K+

    Technology products tracked across active accounts

    105+

    Countries with verified technographic coverage

    Rolling It Out in Four Steps

    1. Define the ICP with firmographic guardrails first — size, industry, geography.
    2. Layer in technographic filters: complementary stack, competitor install base, or capability gaps.
    3. Add a behavioral signal to time outreach — search intent, hiring signals, or funding events.
    4. Push the combined segment into your CRM and sequencing tool as one list, not three.

    The output is a shortlist that’s both a good fit and actively in-market — the combination every SDR team wishes they started with.

    Want the data behind your next ABM push?

    Get a free sample of technographic and firmographic data filtered to your exact ICP.

  • Building Your ICP for ABM With Technographic Signals

    Building Your ICP for ABM With Technographic Signals

    Account-based marketing only works when you’re targeting the right accounts. That precision starts with an ideal customer profile (ICP) — a clear definition of the companies most likely to buy, stay, and expand. Most teams build an ICP from firmographics alone. The best teams add technographic signals.

    The three layers of a strong ICP

    • Firmographic — industry, company size, revenue, and geography.
    • Technographic — the platforms and categories that signal fit and readiness.
    • Behavioral — engagement and intent signals that indicate timing.

    Why technographics sharpen the ICP

    Two companies can look identical on paper — same size, same industry, same region — yet one is a perfect fit and the other will never buy. The difference is usually in the stack. Technographic signals reveal whether an account already runs the tools your product complements, or the competitor you displace. That context turns a broad firmographic list into a ranked, prioritized target account list.

    From ICP to target account list

    Once your ICP is defined, the job is to find every account that matches it and load them — with verified contacts — into your ABM engine. This is where a purpose-built B2B database earns its keep: instead of manually researching accounts, you pull a clean, technographic-filtered list that maps directly to your profile and is ready for sales and marketing to act on together.